blackpool FY2 Postcodes
Spending a fortune on conveyancing?

Compare instant, low-cost online quotes from trusted conveyancing solicitors.
Backed by experts, our no-obligation service searches through the best conveyancing quotes on the market to save you time and money.
Blackpool (FY2)
The FY2 postcode area is located in the Blackpool postcode town region, within the county of Lancashire, and contains a total of 691 individual postcodes.
There are 4 electoral wards in the FY2 postcode area, including Blackpool, Fleetwood, Lytham St Annes, Poulton-Le-Fylde, Thornton-Cleveleys which come under the local authority of the Blackpool Council.
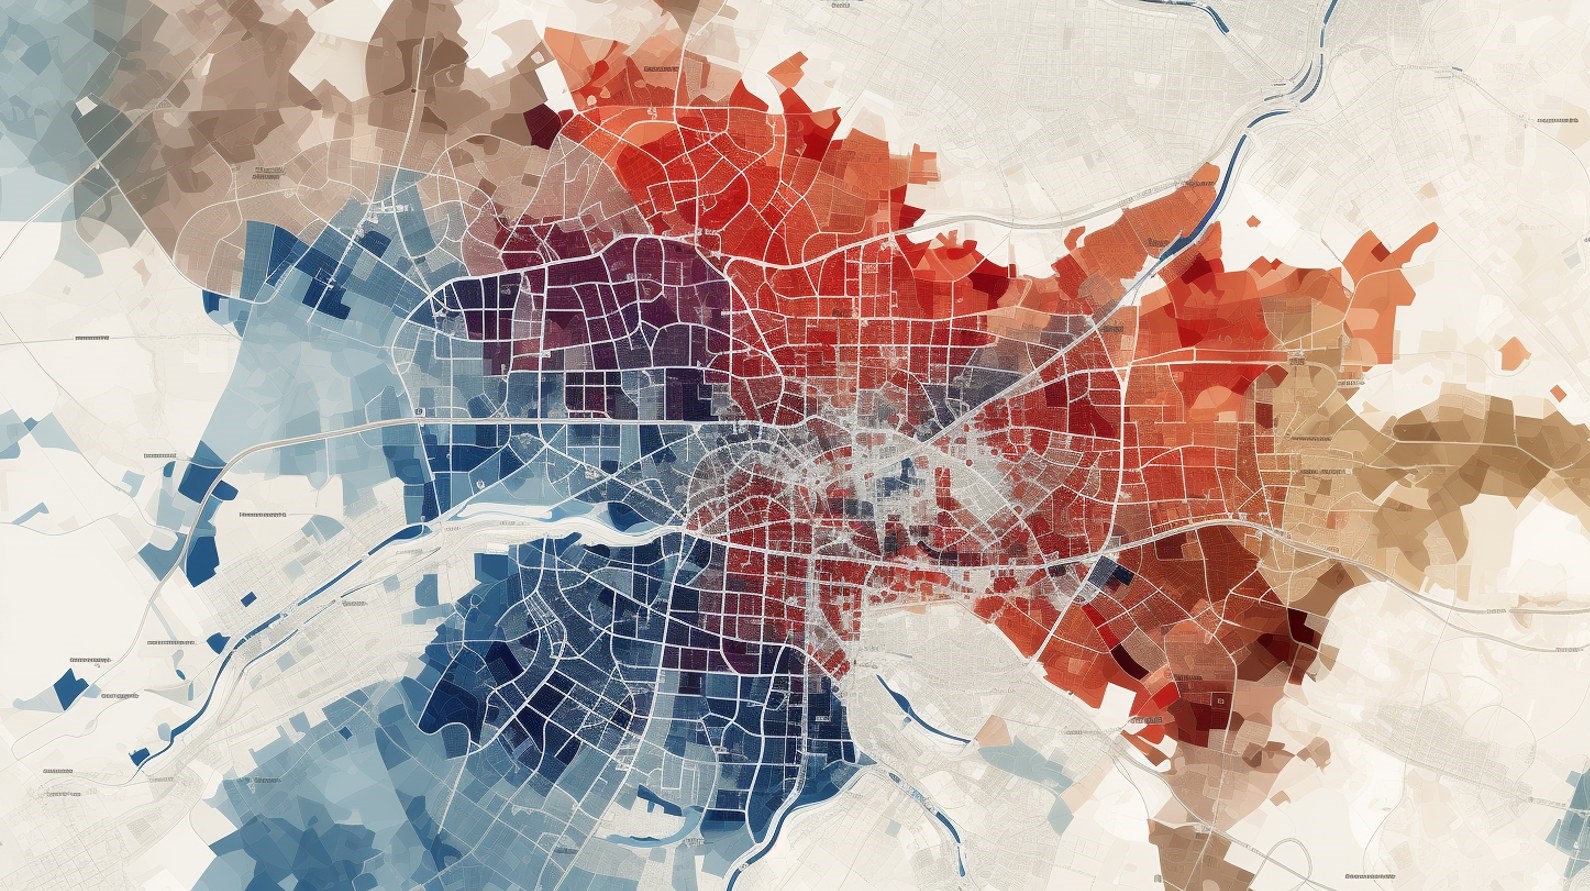
Combining the whole postcode region, 13% of people in FY2 are classed as having an AB social grade, (i.e. 'white-collar' middle-upper class), compared to 27% across the UK.
This does not mean that the people of FY2 are poorer than other areas, but it may give an indication that there are areas of deprivation.
FY2 is a postcode district in the Blackpool district of Lancashire in the United Kingdom. It is mainly residential and is home to approximately 17,000 people. Located on the Fylde coast near Liverpool and Manchester, FY2 is centrally located to a number of popular tourist and leisure attractions, such as Blackpool Tower, the Pleasure Beach and Stanley Park.
It is served by Blackpool North railway station, which provides regular services to Manchester Airport and Manchester city centre. Local bus and tram services run to the neighbouring districts of St Annes and Cleveleys, with certain services extending to Lytham and Preston.
The FY2 area's main employment is tourism related. Some of the area's major attractions include the Sea Life Centre, the Stanley Park Zoo and an indoor adventure centre.
The district is home to numerous sports clubs, such as Fleetwood Amateurs FC, Blackpool FC, Gynn Squash and Racketball Club and Blackpool Blazers Hockey Club. There are also a few well-known chain stores in the area, including the Broadway Shopping Centre, Sainsbury's Superstore and Boots.
The district also hosts a number of events and festivals throughout the year, with the most popular being Blackpool Illuminations switching on ceremony in September, Viva!, Abroad Festival at the Tower Headland and Revolucion de Cuba.
The area consists of mainly terraced and semi-detached housing, with some detached properties. Nearby private housing is available in St Annes, Cleveleys and Lytham, whilst new-build properties can be found in Bispham and Little Bispham.
A number of schools are located in this district, such as St Kentigerns Catholic Primary, Anchorsholme Primary School, Beaconsfield Primary School, Upper Meols Primary School and Holy Family Catholic Primary School.*
The area's education provision is complemented by a range of good pubs, cafes and restaurants, many of which are located near the beach.
FY2 is an excellent place to live, work and play; providing the perfect combination of world-class attractions, business opportunities and a wide range of leisure activities in a vibrant, friendly neighbourhood.

Demographics
Lancashire

FY2 is located in the county of Lancashire, in England.
Lancashire has a total population of 1,485,000, making it the 8th largest county in the UK.
Lancashire has a total area of 1187 square miles, and a population density of 482 people per square kilometre. For comparison, Greater London has a density of 5,618 people/km2.

| Outward Code | FY2 |
| Postal Town | Blackpool |
| MSOA Name | Blackpool 002 |
| LSOA Name | Blackpool 002E |
| County | Lancashire |
| Region | Lancashire |
| Country | England |
| Local Authority | Blackpool |
| Area Classification | Urban with City and Town |
FY2 Electoral Wards
The postal region of FY2, includes the local towns, villages, electoral wards and stations of:
Dig even deeper into the FY2 postcode by clicking on a postcode below:
Click on an outward postal code below for more information about the area. Each 'outward' postcode give you a comprehensive list of all postcodes within the outward code area (FY) and estimated address.
Click on an 'outward' code for more information. For example, the outward postcode page 'EC2M' will give you an alphabetical list covering all postcodes located in the region, from 'EC2M 1BB' through to 'EC2M 7YA'.
Chris H
Sunday, April 7, 2024
We don't have any views of FY2 right now. If you live in FY2 or have visited it, please help us to help others by telling others what you think of this neighbourhood.
Add your view of FY2
People need your local expertise. If you live in FY2 or have first-hand knowledge of the neighbourhood, please consider sharing your views. It's completely anonymous - all we ask is for your initials.
Please tell us what you like about the FY2 postcode area, what you don't like, and what it's like to live or work here.
| LOCAL AMENITIES | |
| FAMILY FRIENDLY | |
| PARKING | |
| GREEN SPACES |
Local News Lancashire
Man arrested after mosque break-in
A man ran away after he was challenged by some men already inside the building, police say.
BBC NewsStansfield hits winner as Birmingham beat Preston
Jay Stansfield's 68th-minute winner beats promotion-chasing Preston to earn Gary Rowett's first win back as Birmingham City boss.
BBC NewsTrain strikes: How will you be affected?
Rail workers at 16 companies are taking industrial action but tube strikes have been called off.
BBC NewsLyon 'disappointed' by shortened Lancashire stint
Australia spinner Nathan Lyon is disappointed his spell at Lancashire this summer will be shortened to manage his workload.
BBC News'Arranged' gang fight causes distress for residents
Police in Burnley and Rawtenstall town centres were tackling reports of a "pre-arranged fight".
BBC NewsWolves hit back to deny Burnley crucial win
Burnley miss out on a chance to boost their survival hopes as they are held to a frustrating draw by Wolves at Turf Moor.
BBC NewsVolunteer groups at 'crisis point' over NHS referrals
Organisations in Lancashire say they are under pressure due to a rapid increase in "social prescribing".
BBC NewsCampaigners call for cemetery to be protected
They are urging a bishop to keep the site as a cemetery and stop it being redeveloped.
BBC NewsFrom the Postcode Area blog
Deciphering Crime Rates - a Deep Dive Into UK Postcode Analysis
Ever wondered about the crime rate in your UK postcode? You're not alone. We've dug deep into the data, uncovering trends and patterns that'll make your head spin.
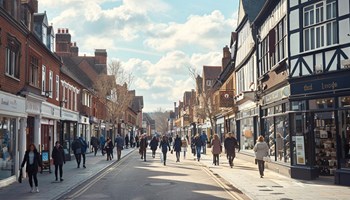
Death of the High Street?
The BBC reports that despite councils' attempts to kurb them, the UK's high streets have seen a huge growth in fast food outlets. Could this mark the death knell for the Great British high street, and what can we do about it to halt its decline?
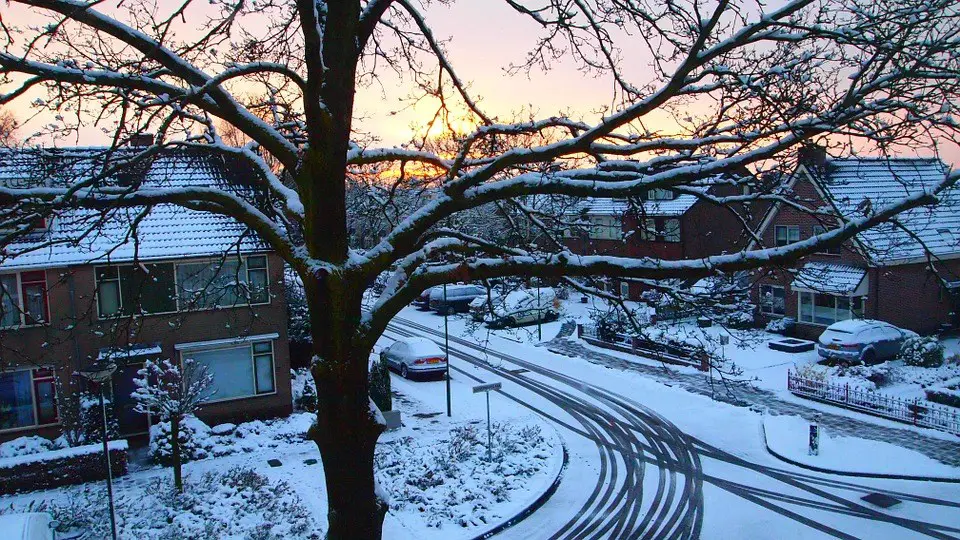
Discrimination by Postcode
You really couldn't make it up, could you? Some of the country's most vulnerable people are missing out on their weekly £25 Cold Weather Payment, just because the system that's in operation is discriminating against them because payments are based on postcode, rather than geographic location.
The Redesign is Underway
Well, the current website was absolutely in dire need of a good redesign - from the ground up. So I set out to pull it all apart and get it up and running again to become the most comprehensive guide to every postcode in the UK. And it's been a long, tough job from start to finish - and quite possibly the biggest project I've ever undertaken.
SOCIAL GRADES
According to census records, 13% of people here have a social grade of AB (highest), compared to the national average of 27%.